The coronavirus genome is like a shipping label that lets epidemiologists track where it’s been

nextstrain.org, CC BY
By Bert Ely, University of South Carolina and Taylor Carter, University of South Carolina
Following the coronavirus’s spread through the population – and anticipating its next move – is an important part of the public health response to the new disease, especially since containment is our only defense so far.
Just looking at an infected person doesn’t tell you where their version of the coronavirus came from, and SARS-CoV-2 doesn’t have a bar code you can scan to allow you to track its travel history. However, its genetic sequence is almost as good for providing some insight into where the virus has been.
An organism’s genome is its complete genetic instructions. You can think of a genome as a book, containing words made up of letters. Each “letter” in the genome is a molecule called a nucleotide – in shorthand, an A, G, C, T or U.
Mutations can occur every time the virus replicates its genome, so that over time mutations accumulate in the viral genome. For example, in place of the “word” CAT, the new virus has GAT. The virus carries these minor modifications as it moves from one person to the next host.
These mutations behave like a passport stamp. No matter where you go next, previous stamps in your passport still show where you’ve been.
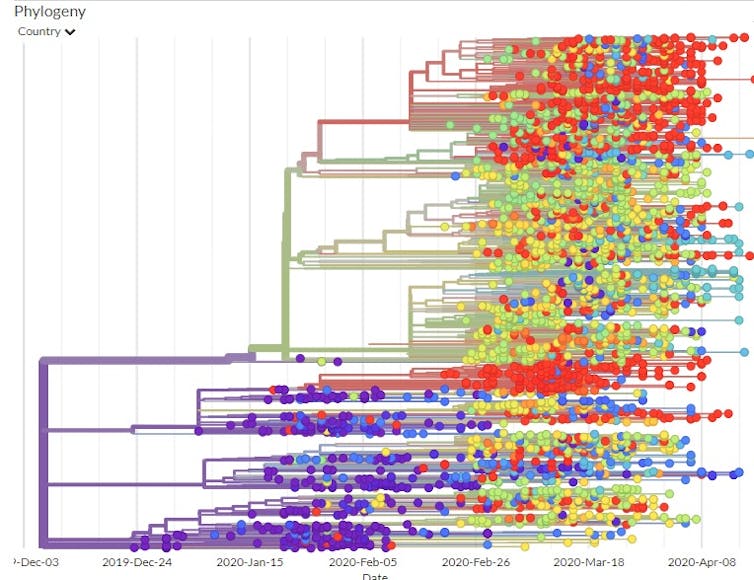
Molecular geneticists like us can use this information to construct family trees for the coronavirus. That allows us to trace the routes the virus has traveled through space and time and start to answer questions like how quickly and easily does it spread from one person to another?

STR/AFP via Getty Images
Individual patient data help paint a big picture
Online databases have been collecting SARS-CoV-2 genomic nucleotide sequences since mid-December. Whenever a patient tests positive for SARS-CoV-2, a lab can determine the genome sequence of the infecting virus and upload it. As of late April, more than 1,500 genome sequence samples have been deposited in GenBank, a publicly available database run by the National Institutes of Health, and more than 13,000 are in GISAID, the open-access Global Initiative on Sharing All Influenza Data.
Since each sequence is from a patient who is in a specific place in the world, these viral genome sequences allow scientists to compare them and track where the virus has been. The more similar the sequences from two particular viruses are, the more closely related they are and the more recently they’ve shared a common ancestor. The first SARS-CoV-2 genomic sequence uploaded to the GISAID’s website was collected from a patient in early December 2019.
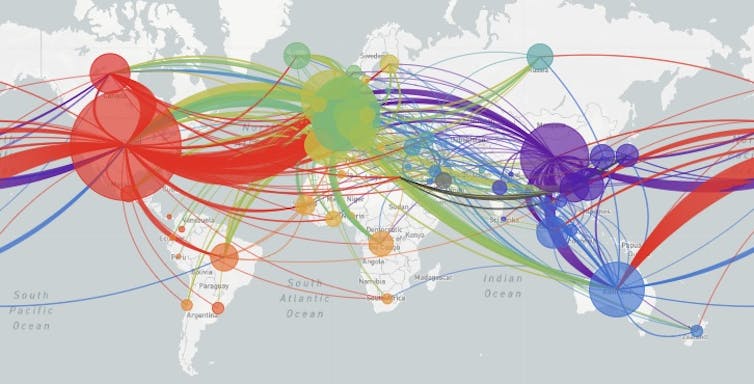
Of course, the viral mutations themselves do not tell researchers which country they happened in. But since the databases record where particular patterns of mutations have been observed, scientists can determine the route that each viral strain has taken. The global map tracks the movement of the virus around the world.
The data recorded from thousands of patients show that SARS-Cov-2 originated in Wuhan China and spread from there to the rest of the world.

nextstrain.org, CC BY
Building maps out of sequences
The genetic data can play a big role in cracking public health mysteries, like how the coronavirus has spread through the United States.
For example, a traveler from Wuhan arrived in Seattle on Jan. 15 and tested positive for the virus on Jan. 20.
On Feb. 28, scientists sequenced a virus sample from an American patient in Seattle and found its mutation signature matched that of the virus from the Wuhan traveler, plus three new mutations. GISAID has estimated the mutation rate at about 0.45 mutations per genome per week – so three mutations between the Jan. 20 case and the Feb. 28 case fits that rate.
Based on the three new mutations, this version of the virus had been multiplying undetected for about five weeks in the Seattle area. Since each infected person can infect several other people without experiencing any symptoms themselves, the virus could have spread to more than 100 people in five weeks.
Using the genome sequences to link the virus from the Jan. 15 traveler from Wuhan with the Washington-based patient from the end of February alerted Washington state officials that the virus was silently spreading through the population. This undetected spreading of the virus in Seattle and elsewhere is one of the primary reasons public health officials are calling for the public to stay home as much as possible.
Another study detailed the path the virus took as it moved from Wuhan to Shanghai to Germany to Italy to Mexico, stowing away in infected travelers. This study tracked infected individuals and compared their viral genomic sequences. Since researchers could compare the viral mutations to those in known locations at specific times, they were able to map out the phylogenetic tree – the family tree that shows how the various virus genome sequences are related.
Using the GISAID estimated mutation rate and the phylogenetic tree, scientists think the first time the coronavirus infected a person likely occurred in Wuhan in November or early December 2019.
If the virus had been around much longer, the viruses of the first known patients would have had a larger variety of mutations than they did.

Anadolu Agency via Getty Images
Still tracking and learning from the sequences
The analysis of viral genomic sequences will continue to be a valuable tool for tracking and containing the spread of SARS-CoV-2.
For instance, sequencing the genome of a virus from a newly infected patient could tell you if it is a virus that has been circulating in the area for a while, or if it is a new introduction from elsewhere.
Someone who’d been in northern Italy before travel restrictions were in place brought the virus to Iceland. That initial outbreak was contained fairly quickly, but then new forms of the virus were introduced from elsewhere in Europe.
A new study pending peer-review indicates that California also had multiple introduction events with distinct viral lineages. For California, knowledge of the frequency of new introductions would be an important factor to consider as officials devise ways to contain the virus.
Viral genome sequences can be informative in other ways as well. Eventually, researchers may find that some forms of the virus are more virulent than others. In that case, the sequence of the viral genome could help physicians decide which treatment would be best for a particular patient.
This article was updated to correct a typo in the number of viral genomes uploaded to GISAID by April 27. It is more than 13,000 not 3,000.
[You need to understand the coronavirus pandemic, and we can help. Read The Conversation’s newsletter.]![]()
Bert Ely, Professor of Biological Sciences, University of South Carolina and Taylor Carter, PhD Student in Biological Sciences, University of South Carolina
This article is republished from The Conversation under a Creative Commons license. Read the original article.